February 18 2026
 3 min read
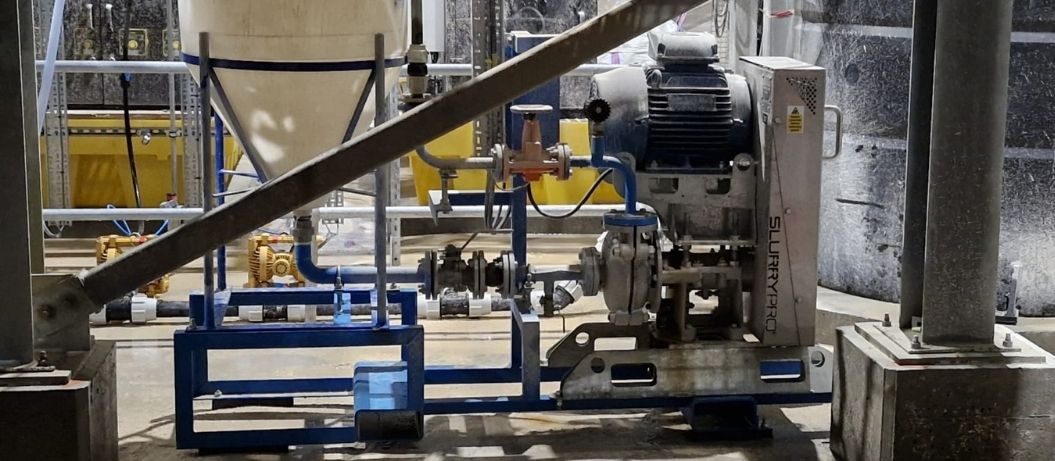
For process managers, a pump is rarely just a piece of equipment; it’s the heartbeat of a production line. When a critical pump fails unexpectedly, it’s not a mere maintenance issue—it’s a costly production crisis.
Historically, pump maintenance has fallen into two camps: reactive (“run-to-failure”) or preventive (“scheduled replacement” or “preventative maintenance”). The former is chaotic and expensive due to unplanned downtime. The latter is wasteful, often replacing perfectly good parts based on a calendar date rather than actual condition.
Today, industry is shifting away from these outdated models, using Condition-based Maintenance (CbM) and moving towards advanced Predictive Maintenance (PdM).
The goal is no longer just to know if a pump is running, but how well it is running and, crucially, how long it will continue to run before a wear part requires replacement. PdM extends the forecast period from CbM’s “weeks” to “months” by adding AI/ML to Condition Monitoring (CM).
This shift allows for forecasting maintenance needs months in advance, optimising spare-part supply chains, refining budgets, and scheduling interventions during planned plant shutdowns. Best of all, the most effective diagnostic tests can be performed entirely online, without stopping the pump or interrupting the process.
Here is a guide to essential online condition-monitoring techniques for forecasting pump health.
A Paradigm Shift: From Fault Detection to Performance Trending
Before detailing the tests, let us define the strategy. A single reading from any sensor is just a snapshot. A pump issue detected by a subsequent process breakdown is too late. The power of predictive forecasting lies in trending.
By establishing a “baseline” (how the pump runs when new or freshly overhauled) and continuously monitoring deviations from that baseline over time, we can plot the rate of degradation. It is the rate of change that allows us to predict when a bearing, seal, or impeller will reach the end of its useful life.
Here are the four primary non-intrusive tests that provide the data for these forecasts.
1. Vibration Analysis: The Gold Standard
Vibration analysis is the single most effective tool for monitoring rotating equipment. Almost every mechanical fault inside a pump generates a unique vibratory signature.
- How it works online: Accelerometers are magnetically attached or permanently mounted to bearing housings on the pump and motor. They record vibration amplitude (severity) and frequency (how fast the vibration occurs).
- What it predicts:
- Bearing Wear: As rolling elements inside a bearing begin to pit or spall, they create distinct high-frequency vibrations long before they fail catastrophically. Trending these frequencies provides allows for precise prediction of remaining bearing life.
- Misalignment and Imbalance: These issues put immense stress on seals and bearings, accelerating their wear. Vibration detects bearing housing movement that indicates shaft misalignment or impeller imbalance.
- Hydraulic Issues: Internal recirculation or vane-pass issues generate specific vibration frequencies, indicating internal wear or operations outside the pump’s Best Efficiency Point (BEP).
The Forecasting Value: By tracking the slow, upward creep in overall vibration levels, you can predict the “knee of the curve”—the point where degradation accelerates rapidly—and schedule replacements just before it occurs.
2. Acoustic and Ultrasonic Monitoring
While vibration monitors physical movement, ultrasonic sensors detect sound above the range of human hearing. This is particularly useful for early-stage fault detection and specific hydraulic phenomena.
- How it works online: A handheld sensor or permanently mounted microphone is pointed at bearing housings or the pump casing while it runs.
- What it predicts:
- Very Early Bearing Failure: Ultrasonic sensors often detect lubrication issues and low-level bearing friction before human-detectable vibration occurs. It provides the earliest possible warning, and helps visualise trends over time.
- Cavitation: When a pump is “starving” for fluid, vapor bubbles form and collapse violently inside the impeller. This sounds like gravel rattling in the pump to the naked ear, but ultrasonics clearly pick up the distinct signature of cavitation. Chronic cavitation rapidly destroys impellers; detecting it early saves the hydraulic end.
3. Hydraulic Performance Monitoring – The “Smart” Approach
These techniques often don’t require additional, expensive sensors, yet are frequently overlooked. They utilise the process instrumentation you likely already have installed —flow meters, pressure gauges (suction and discharge), and motor amp readings.
The beauty of these tests is that they can be done without dismantling the pump.
In duty test: Dynamic Discharge Pressure
With all valves fully open and the pump running, note the discharge pressure gauge reading. This informs us of the actual system/duty pressure as it is currently running.
Next, take note of the amount of consumed power and compare the readings with the pump’s curve chart (available from the manufacturer) – and if available, previous readings you’ve taken.
By integrating these data points into a control system or dashboard, you can continuously calculate the pump’s actual performance against its original manufacturer’s curve.
- What it predicts:
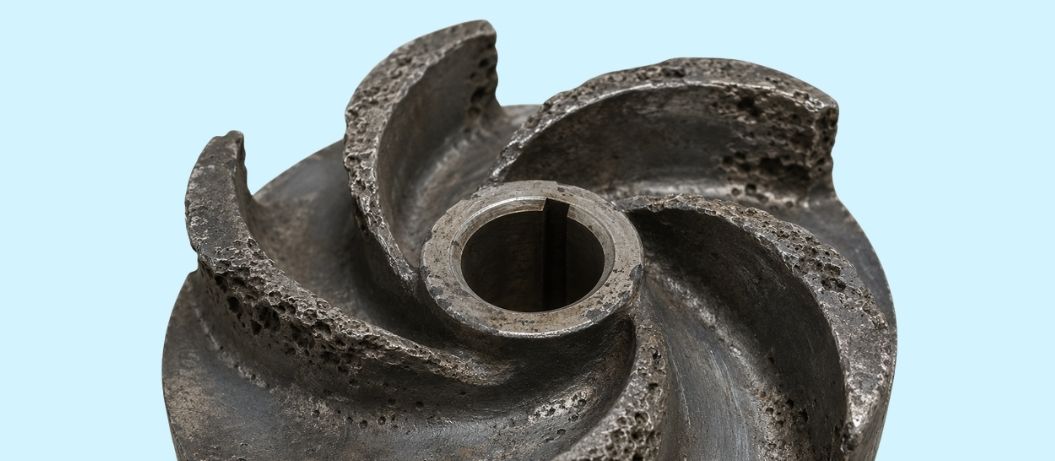
- Impeller and Wear Ring Degradation: If the pump is drawing the same amount of power but producing less flow or head (pressure) over time, it is a clear indicator that internal clearances have increased due to wear. The fluid is recirculating inside the pump rather than moving down the pipe.
- Efficiency Loss: By monitoring electrical current draw relative to hydraulic output, you can track efficiency. A gradual drop in efficiency is a direct proxy for internal wear.
The Forecasting Value: A 5% drop in hydraulic head (pressure) at a given flow rate is a common trigger point for planning an impeller or wear ring replacement. Trending this data allows you to see that drop coming; weeks or months ahead of time.
Online, process off: The Closed Valve Test
This is very useful if you have a pressure gauge fitted on the discharge but lack a flow meter.
How it works: With all valves fully open and the pump running, note the discharge pressure gauge reading. This reports the actual system/duty pressure while the system is running at its usual duty.
Now, slowly close the valve on the discharge pipe (downstream of the pressure gauge). You want to restrict the flow gradually until it ‘dead-heads’ – being careful not to shut it off too quickly to avoid ‘water hammer’ and shock damage.
As you close the valve, observe the pressure reading; it should rise if the pump is healthy. In theory, a non-worn positive displacement type of pump should attain its rated pressure, eg 6 bar for a single-stage 6 bar-rated pump.
If the pressure fails to attain it’s rating, it means that internal leaking, or back slip, is occurring. This is when the fluid is being forced back between the rotator/stator, lobes or piston ram. Slip rate increases with wear rate, and as more fluid slips back, the wear increases disproportionately – especially with abrasive fluids.
With centrifugal pumps, a rise in temperature when dead heading is normal, due to the fluid recirculating. Always keep dead heading periods as short as possible – seconds, not minutes.
With regular closed-valve tests, data points can be recorded in a control system or historian, enabling continuous calculation of the pump’s actual performance against the original manufacturer’s curve.
4. Thermography and Temperature Trending
Heat is almost always a symptom of inefficiency or friction.
- How it works: Simple spot checks with infrared cameras or data from permanently mounted RTDs/thermocouples on bearing housings.
- What it predicts:
- Bearing Issues: A bearing running hotter than its baseline is usually suffering from lubrication breakdown or late-stage wear.
- Mechanical Seal Failure: For pumps with flushed seal plans, a spike in the temperature of the seal flush fluid often indicates impending seal face failure.
Summary: The Layered Approach
A robust predictive strategy doesn’t rely on just one of these tests. Like a 3-legged stool, your pump health diagnostic strategy is on a firm footing when you layer data from different parameters. Depending on the specific issue, a suite of results from 3 of the 4 areas explained above will provide a highly accurate picture of pump health.
For example, thermography might detect high temperature within the pump. Is it friction from worn components, dry-running, or recirculating flow? Hydraulic measurements (flow & pressure) alongside vibration analysis will narrow the cause down to either pump wear or fluid properties.
By layering these health diagnostic tests, process managers gain a multidimensional view of asset health. This moves the organisation away from reacting to sudden silence on the plant floor and toward a proactive, data-driven strategy where replacement parts are ordered in time, and downtime is always planned.
Get help from a pump expert.
Atlantic Pumps offers ad hoc pump inspections through to a fully managed condition-based monitoring and maintenance regime for all industrial pump types.
We tailor our service from full-service options to supporting your inhouse engineers with specialist pump support.
We also take a sustainable approach to our work and are committed to reducing energy waste from pumps. Our expert knowledge allows us to reduce energy usage by 20% on the average site!
Call us today on 0808 196 5108 for more information.